|
|||||||||||||||||||||||||||
|
Figure 1: The research process in the e-Hermes project. Quantitative results of the project
are obtained by numerical methods. Many statistical tests were carried
out in order the development of understanding, knowledge and attitude
towards the use of new tools as communication channels, to be observed.
Many comparisons between the students' groups from the three countries
(Austria, Germany, Greece) were also performed. Differences between
pre-test and post-test were analysed on the basis of regression-transformed*
differences between pre- and post-test (Hays, 1973). For the standardised
residuals of the linear regression between pre-test and post-test over
all subjects comparison between experimental and control group has been
performed with Mann-Whitney's U-test (Hays, 1973).
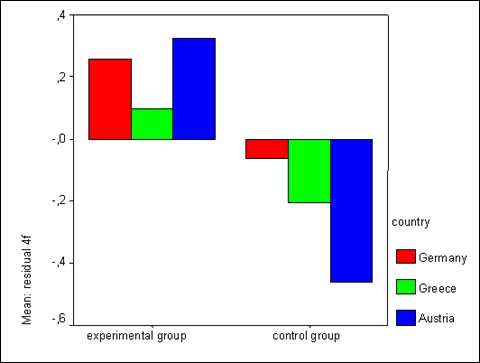
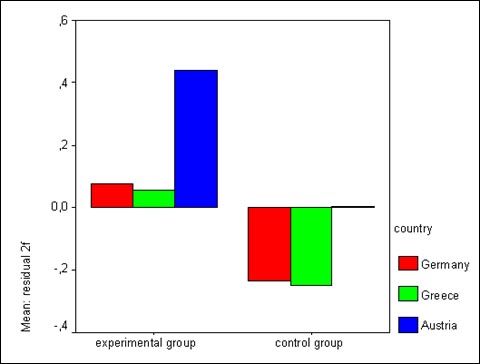
Figure 2: Relative changes of experimental group
and control group between pre-test and post-test for the students' answers
to questions about the "usage of Internet in the classroom" and their
"interest in foreign subjects".
In figure 2 the relative changes of
the experimental and the control group between the pre- and the post-test
for the students' answers to questions about the "usage of Internet
in the classroom" and their "interest in foreign subjects" are presented.
A detailed presentation of the results of the quantitative analysis
of the project is presented in (Apostolakis et al., 1999). In parallel
qualitative results have been drawn. The quantitative analysis of the
project shows to which extend the students succeeded in playing the
roles chosen for them during the project's implementation. The main
results of this analysis are based on the teachers' assessment of the
students during the implementation of the project. In order to evaluate
teachers' conclusions a series of "quality control" factors were used.
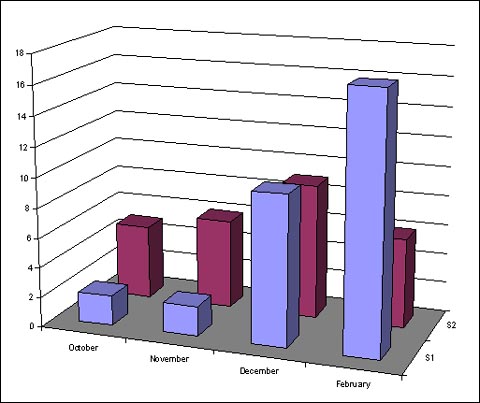
A very interesting example is presented in figure 3. The "quality control"
factor is the number of contributions to the two Bulletin Boards of
the project. The first one is related to discussions of general interest.
The second one was devoted to discussions on the measured quantities.
It was a general filling during the first months of project's implementation
in the classroom that students were not so interested in participating
in discussions through the Bulletin Boards. In order to activate students
the idea of Videoconference was introduced the last week of November
1998. Students first had to discuss their ideas during a videoconference
and then make their remarks and suggestions for the possible answers
to the questions presented in the Bulletin Board. As it can be seen
from the histogram there is an important rise in the number of contributions
to the scientific Bulletin Board after the application of videoconference,
while the number of contributions to the other Bulletin Board is more
or less constant during the whole running period of the project.
Figure 3: Determination of students' behavior towards
the project's implementation. Columns S1 represent the number of students'
contributions to the scientific Bulletin Board (answers to the question
of the month) while columns S2 represent the contributions to the Bulletin
Board where general topics were discussed. Please note the significant
increase in the number of contributions after the introduction of videoconference
in the beginning of December.
The implementation of the project thus far shows that it offers significant advantages in the following aspects of everyday teaching:
*Linear regression means the determination of the straight line that is assumed to represent best a linear correlation between two or more specific variables. A residual of this linear regression is the distance of one value to this straight line. Calculating the residuals of the linear regression between the pre-test and the post-test, leads to level-independent measurements for existing differences between the two tests. In contrast to simple subtractions (post-test minus pre-test) these values reveal differences that are independent from the initial value. If, for example, a person marks a high score in the pre-test, he will likely mark a lower score in the post-test (statistical regression effect). Especially comparisons between different groups (country, gender, etc.) could then lead to incorrect results.
Comments, remarks or questions to: admin@ellinogermaniki.gr |