Hello friends
from ESEM, we are here again!
|
Hello
friends from ESEM, we are here again! Annika Peter, Oliver Stoppler,
Till Bischoff, Sebastian Spengler and their teacher Sebastian Ely
would like to discuss with you the results of the measurements,
so as to start a scientific conversation, which should have been
taken place long before. Or else what do you think is the reason
for taking measurements all this time? 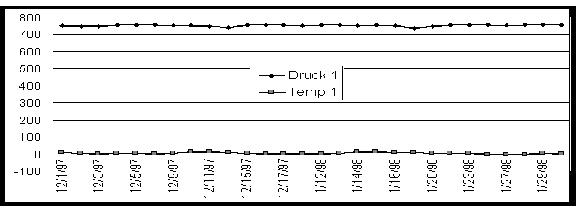
Since pressure and temperature measurements are in a variety of values, we could not find anything common between the two graphs. This problem can be solved by using a “double” y-axis (atmospheric pressure on the left and temperature on the right). 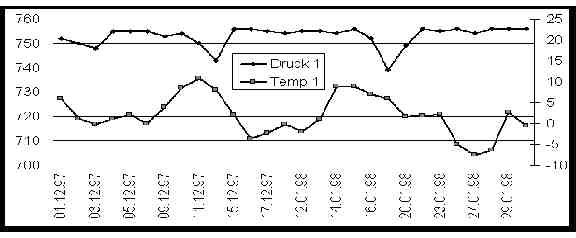
So a discussion started based on the question: why is there this dependence of temperature on pressure? (Or is it pressure depended on temperature?) Sebastian suggested that an increase in temperature causes winds that cause in their turn an increase in the atmospheric pressure. Annika’s opinion was that wind is of course transporting high and low atmospheric pressure, but this has nothing to do with temperature. Mr. Ely indicated that hitting the barometer, one can see how atmospheric pressure is changing. In this way one can find out how is the weather going to develop, that is if the weather is going to be better or worse. You see there are a lot of questions. Maybe you can participate in this discussion. Anyway we would like to know of your opinion and your experiences. Surely you have watched the graphs yourselves and have discussed upon them. We would like to take part in your discussion. Send us your graphs. The address is Ely@schule.uni-frankfurt.de! |
|
|
