|
For the
last three months, we, students of Ellinogermaniki Agogi, take some
daily measurements in the installations of our school. One of the
things we measure is electrical power consumption. Using these measurements,
we plot graphs, so as to easily have concentrative results. In these
graphs we observe that many of the peaks are found in the same height
and in equal time intervals.
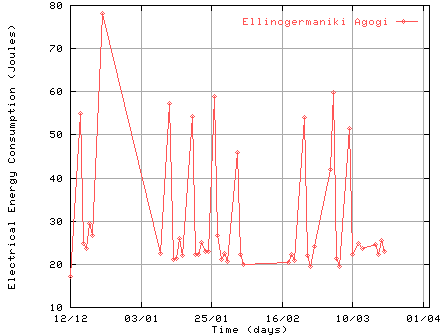
The heighest peak, which shows
the greatest electrical power consumption, corresponds to the period
of Christmas vacation, during which we observe an increase of consumption,
even if the school is typically closed, because of the operation
for the Christmas bazaar.
The rest of the peaks are found
in about the same height and in equal time internals. So the assumption
that they are due to some school activity seems to be incorrect.
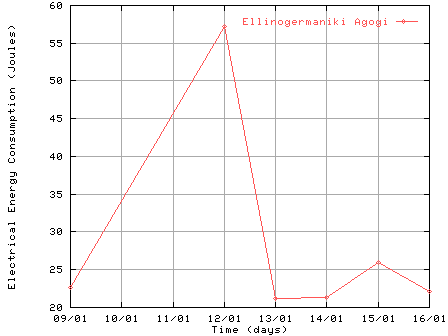
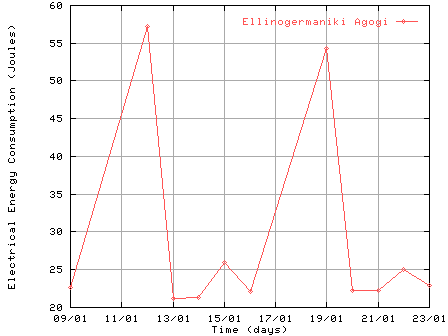
Watching closer we can see that these peaks always correspond to
Mondays. Despite the fact that the school does not work on weekends,
Monday’s measurement is three times higher than an average working
day of the school. The answer to this is in the continuous function
of the 25-meters long swimming pool, as well as machinery installations
of the school (pumps, ventilation). So Monday’s measurement corresponds
to power consumption of Saturday, Sunday and Monday.
 |
| |
 |
For smoothing the graph we
have made the following proposals:
(a) Meassurement of power consumption
of the weekend: Measurement of the consumption during these two
days, which is impossible since the school is closed.
(b) First add to the result
of Monday’s measurements, the power consumption of 5 more days.
Then devide this sum by 7, which is the number of days in which
the measurements correspond. This solution is not very good and
is not going to bring up the desirable result, because there a difference
between measurements from day to day.
(c) Each Monday’s measurements
should be devided by the number of days since the last measurement,
that is the 3-days interval, for finding the amount of power consumption
of each day separately. This solution is impossible, because the
consumption may differ from day to day.
After all these we decided to
continue the same way of taking measurements and making graphs out
of these results.
|
